Interactive Data Explorers
Your dataset has answers in it.
Right now, only you can see them.
I build interactive explorers — maps, filters, comparison tools — that turn a raw dataset into something your users, buyers, or stakeholders can navigate on their own to make a real decision. For property platforms, research teams, and data-heavy products in Singapore and Southeast Asia.
Past clients & collaborators
- The Straits Times
- ISEAS–Yusof Ishak Institute
- SUTD
- Stacked Homes
- Interactive Things
Proof of work
VibeHood — a neighbourhood explorer for Singapore’s property market
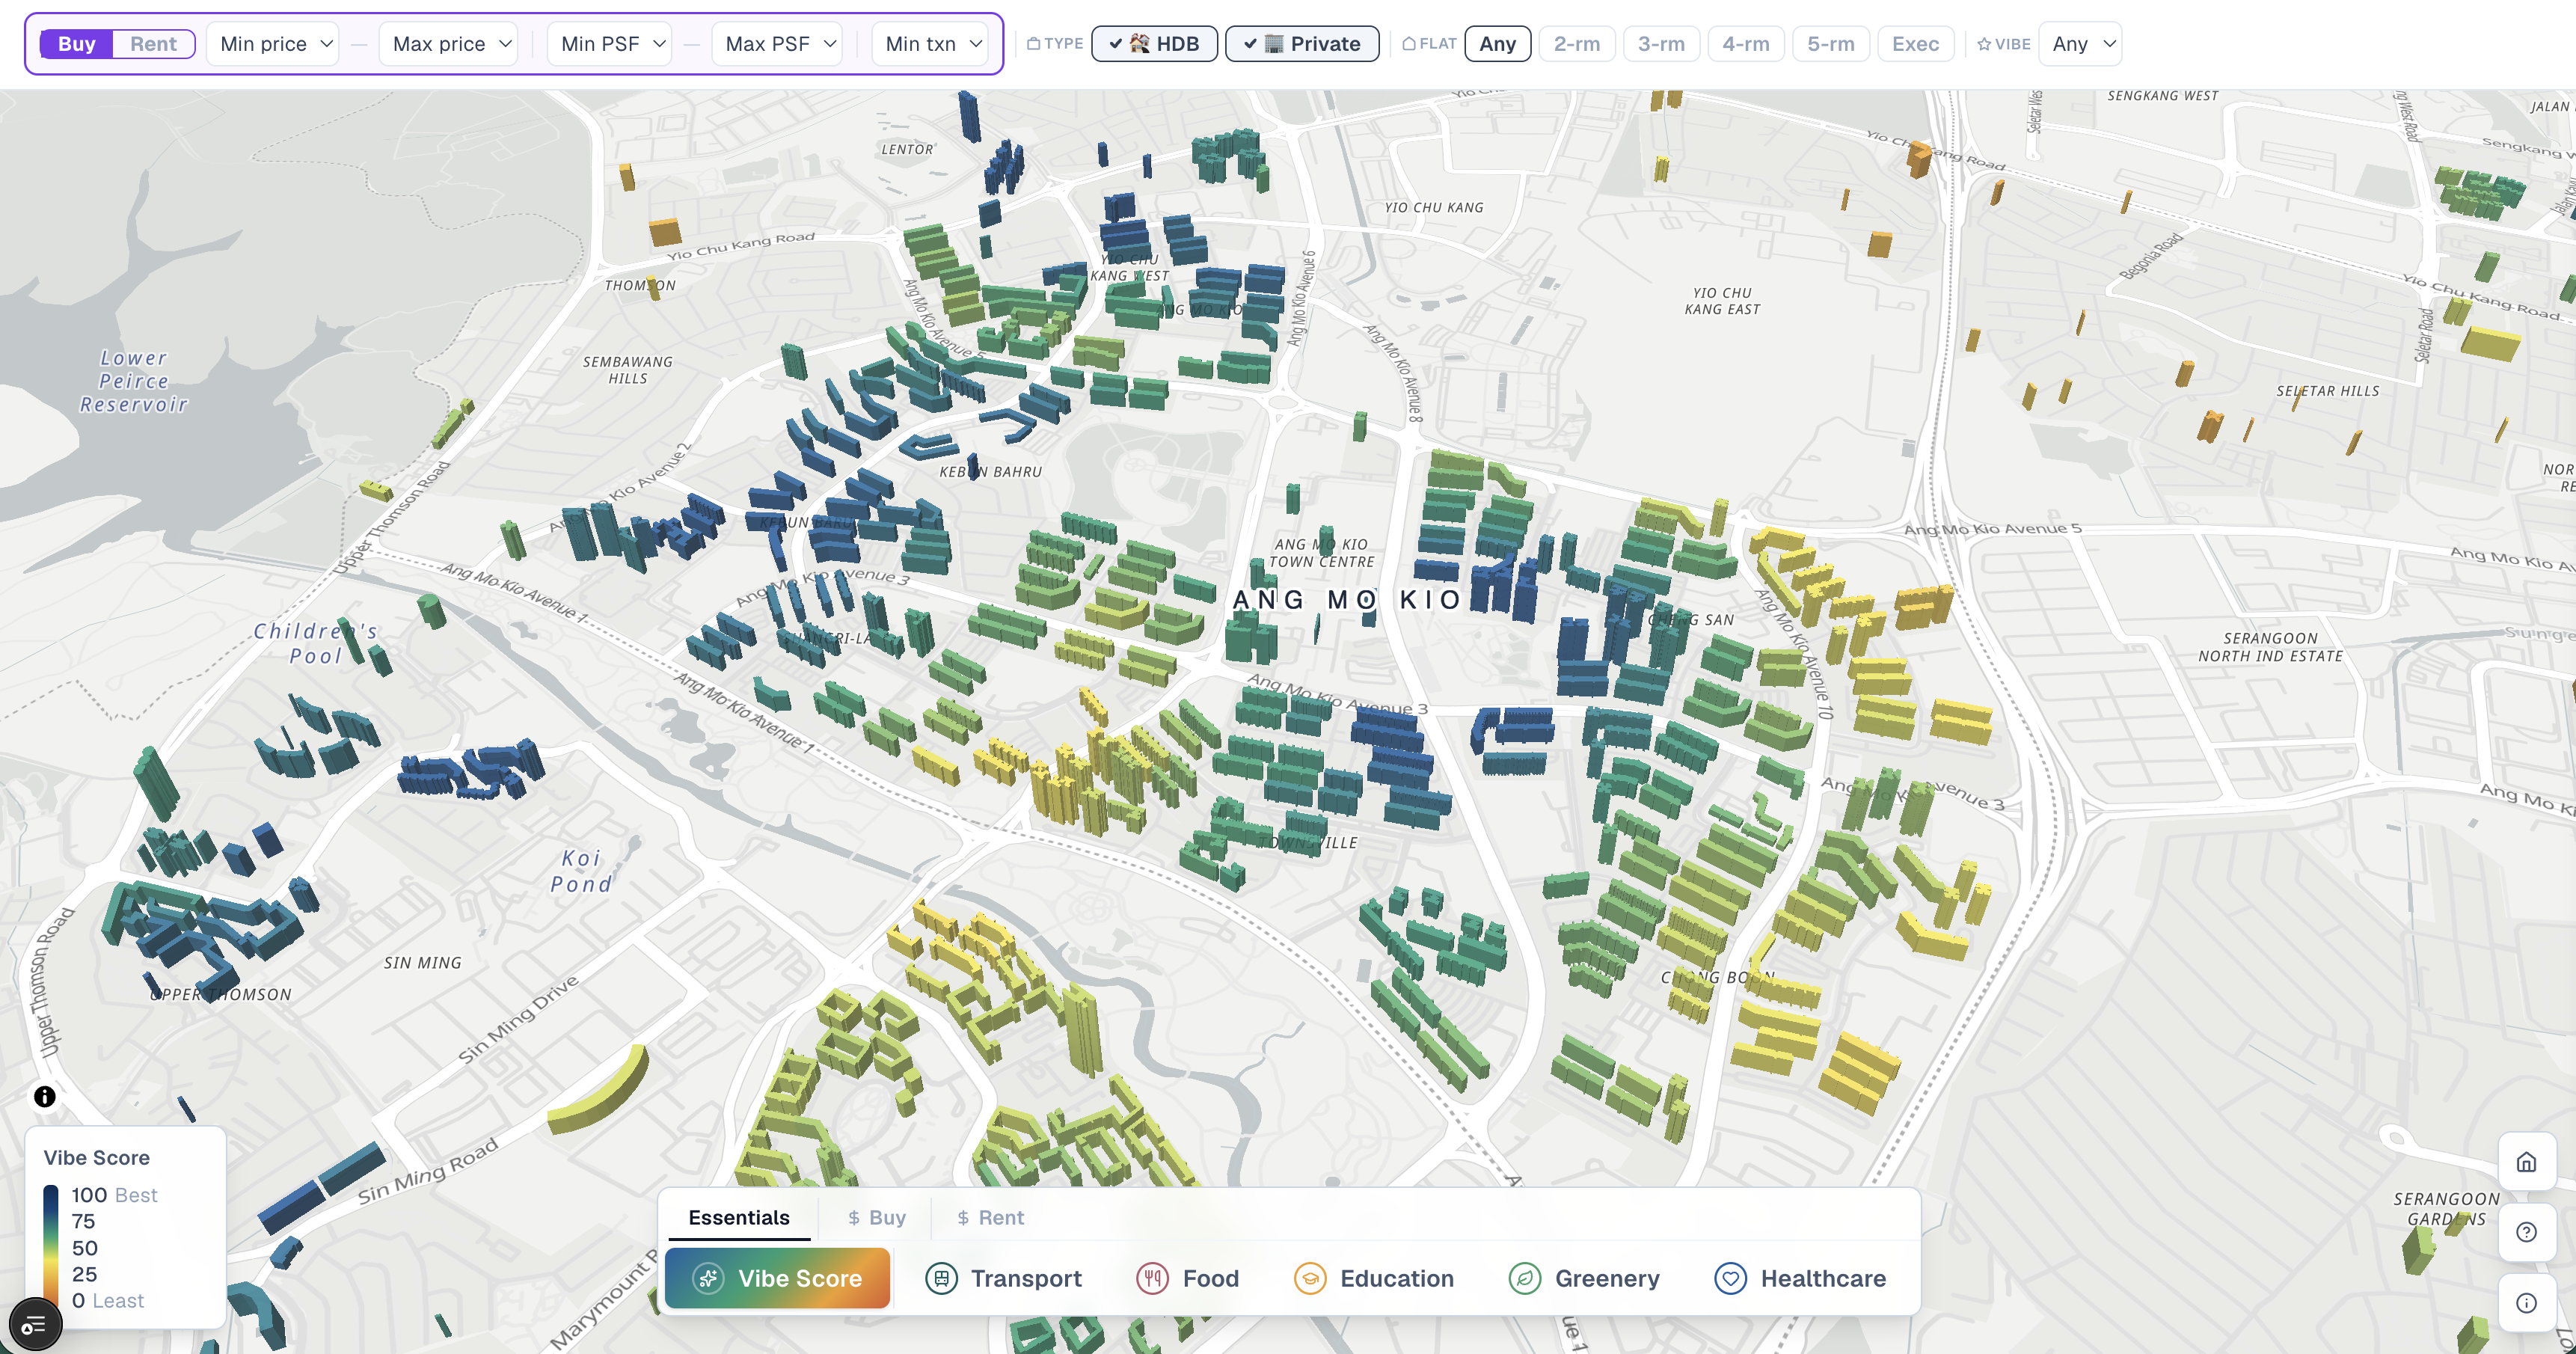
HDB resale data, URA private transactions, and walkability scores don’t mean much as spreadsheets. VibeHood turns them into a 3D map where home buyers and renters filter by lifestyle and see, block by block, where they’d actually want to live.
Interactive work recognised by the Society for News Design — one Gold, four Bronze — and twice shortlisted for the Sigma Awards.
Fit check
Worth a call — or honestly not
This is a fit if
- You have a dataset — property, research, survey, operational — that only makes sense with a filter, a map, or a search box
- People currently get this data as a PDF, spreadsheet, or static dashboard, and it isn’t landing
- You need something users can explore at their own pace to make a real decision, not just view
Probably not a fit if
- You need a standard internal BI dashboard — Tableau or Power BI will get you there faster and cheaper
- The data doesn’t exist yet — an explorer can’t fix a collection problem
- You need it live in under two weeks — good build work doesn’t compress that far
How it works
A fixed process. Scope and price depend on your data.
Discovery call
45 minutesWe talk through your data, your users, and what decision the explorer needs to support. I’ll tell you honestly if it’s a fit — and roughly where it lands in the price band below.
Data audit
~1 weekI look at what you actually have — format, cleanliness, gaps, licensing — and flag what needs work before it can power an interface. This is where scope gets real.
Prototype
1–2 weeksA working, clickable prototype on real (or representative) data — not mockups. You see how it feels to use before committing to the full build.
Build
2–4 weeksFull build: data pipeline, map or interface, interactions, responsive design. You get checkpoints along the way, not a surprise at the end.
Handoff
includedDeployed, documented, and handed to your team — or I keep maintaining it, depending on what you need.
Typical end-to-end: four to eight weeks.
The offer
One build, everything included
Every explorer build ships with
- A working explorer, deployed on your domain
- The data pipeline that feeds it, documented
- Full source code ownership — your repo, no lock-in
- Responsive across desktop and mobile
- 30 days of post-launch fixes included
Most projects land between S$6,000 and S$15,000+ depending on data cleanliness, design depth, and integrations. The discovery call places yours in the band — no surprises after that.
“One of the most talented and creative designers on the team — capable of conceptualizing, developing, and executing a wide range of stories and styles, always maintaining the highest standard of quality.”
Rodolfo PazosInteractive Graphics Editor, The Straits Times
Questions, answered
The things you’re probably weighing
My data is messy and lives in five spreadsheets.
That’s the normal starting condition, not a dealbreaker. VibeHood’s pipeline reconciles three government datasets with inconsistent address formats. The data audit stage exists precisely to surface this early — it affects price, not feasibility.
Who owns the code and the data?
You do, fully. Everything is delivered into your repository with documentation. There’s no proprietary platform underneath and no ongoing fee to keep what you paid for.
How long does a build take?
Typically four to eight weeks end to end, depending mostly on how ready your data is. The discovery call gives you a real estimate, not a hopeful one.
Why not just use Tableau or Power BI?
Those are analyst tools — great for internal reporting. An explorer is a product-grade, public-facing experience: your branding, your domain, designed for people who will never learn a BI tool. Different job entirely.
What happens after launch?
Thirty days of fixes are included. After that, either your team runs it — it’s their code — or we agree a light maintenance arrangement. Your call at handoff, not a decision you need now.
Bring the dataset. I’ll bring an honest read.
Even messy, even half-cleaned. I’ll tell you what scope really looks like — and whether an explorer is actually the right format for it. Solo practice: every build gets my full attention.